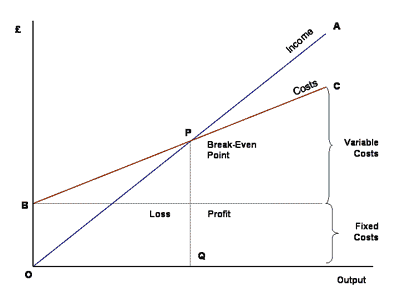
In every business there is a certain level of sales at which costs equal profits. This is know as the break-even point. Its simple to calculate and can be plotted on a break-even chart.
Lets assume an event firm is running a champagne reception. The selling price per ticket is ?10. Each guest gets one glass of champagne and each glass costs ?5. (Ignoring waste). The other costs to consider are the cost of the band (?100) and the hotel room rental (?200). The variable cost is the champagne as the more guests there are the more champagne we need to buy. The fixed cost is the hotel room and band.
The first step is to calculate the contribution per ticket.
Price of ticket ?10
Less cost of champagne ?5
Contribution per ticket ?5
Now thats calculated we can look at the fixed costs
Hire of band ?100
Hotel Room ?200
Total Fixed costs ?300
We know that for each ticket sold their is a contribution of ?5. Obviously to calculate the break-even point we need to divide the total fixed costs by the contribution per ticket. So thats ?300/?5 – 60 Guests.
In general the formula for finding break-even point is
Fixed Costs/ Contribution per unit.


what is contribution line in break even point graph ??